This article was originally published in URISA Texas’ The Lone Star Issue 3
Perhaps one of the most important advances of the 19th century was the advent of refrigeration; allowing the year-round production of lager beer and meat-packing. While the former is experiencing a bit of a renaissance through the rise of craft breweries, the latter has impacted the lives, laws, and health of millions of Americans for more than one hundred years. In 1905, Upton Sinclair published The Jungle, a novel that describes a fictionalized slaughterhouse/meat-packing plant in Chicago detailing the appalling working conditions and unsanitary practices that were common during that time period. For Sinclair, the saliency lay in the abuses of workers’ rights; but the average reader’s concern was more basic– –horror to discover their food was routinely adulterated with sawdust, human and animal matter. Responding to the mass outrage in the following year, the United States Congress passed two laws that would lay the legal groundwork for the modern regime of food safety inspections.
Today, the inspection of food establishments is routine; Texas has codified what should be inspected, how frequently, and what constitutes an infraction of the health code. Less routine; the public’s access to both the overall results and the detailed violations. The short version, a restaurant is “scored” according to how many infractions an inspector finds– –if more than 30 points are deducted then an establishment must re-test within 10 days (it can also be closed). The longer version is, infractions carry different weights; up to 3 points for critical violations, and no, having animal matter in your facility does not incur instant closure. While many cities throughout Texas do provide online access to a table containing a food establishment’s name, address, and “raw” score, it lacks context. What infractions were found? Was this an outlier inspection?, does this establishment usually score well?, or poorly? Texas Law (25 Texas Admin. Code §228.253 (2015)) classifies this inspection report as a public document to be made available for disclosure to a person who requests it.
The basic nature of a GIS Professional should be that of a problem-solver; broke? fix it, missing? find it, and etc. Perhaps, the true artistry of our profession is presenting these solutions in a way that is visually pleasing and easy to “digest”. From my perspective, the web mapping application seemed simple enough– –show our citizenry data that we already collect. After working with Adobe Flex (now deprecated) web map applications for the last few years, I was looking forward to seeing how robust ESRI’s online Web AppBuilder (ArcGIS API for JavaScript, not deprecated) had become. The most difficult part of this project had to do with the logistics of fully fleshing out a large data set.
If the main problem with presenting food safety inspection information is context, how do we provide it effectively? Our chosen format has to be able to answer the specifics of the infraction, and the frequency of when infractions occur. My opinion was that we could preempt requests for disclosure of the inspection reports by making them freely available via the web application; this saves staff time spent on answering freedom of information requests and more closely follows the tenets of transparency in government. Next, we considered what an inspection report actually represents: a single moment of time within the average business day when an inspector visits an establishment. The results of the inspection are dependent on many factors, and ultimately, judging a food establishment for months at a time based off the events of a single half hour does not provide adequate context. A more temporally-holistic approach would be to consider multiple inspections. Satisfying these two conditions was straightforward; implementing this across the dataset was tedious.
Attaching documents to a feature layer is relatively simple, using a standard or advanced license, run the “Enable Attachments” geoprocessing tool. Congratulations!, you can now attach all sorts of files to the dataset that you selected. Pretty neat huh? For space considerations, I would recommend using PDF format (on average, it uses 300kb for two sheets) instead of image files. Our Health Inspectors were already scanning their paper inspection reports so there was no change in their workflow to help support the new dataset. Viewing attachments through your web map application is only a matter of checking a box: show feature attachments as links. This box resides just below the link: Configure Attributes; which is found in the Configure Pop-Up menu available in the web map (different from the web map application, it has the map viewer interface).
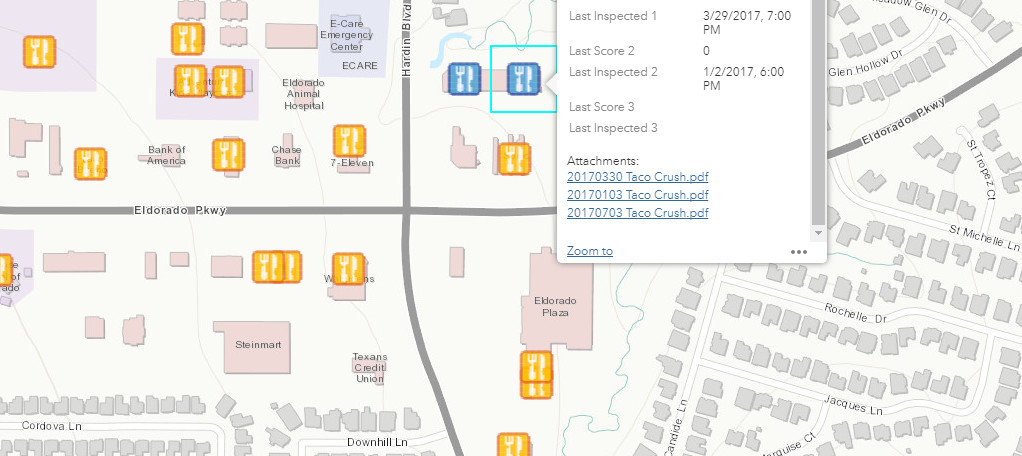
After the modifications to the data schema and the pop-up menu were out of the way, I had the ability to attach PDF documents to the feature layer itself and view them by clicking a link in the feature layer’s pop-up window. Another significant issue stemmed from the size of the data set that I created. Our City currently has 588 permitted, permanent food establishments; additionally, our current City Limit stands at approximately 68 square miles, with a build-out potential a little over 115 square miles. This dataset will grow. Each establishment is inspected 4 times a year, so this translates to roughly 2400 records that need to be updated this year. Let’s say on average it takes one minute to update the individual fields and attach the new inspection report– –you’re looking at 40 hours of work for this single data set for the entire year! Bump it up to two minutes a record and you’re at 80 hours, or two working weeks!
Getting around issues like data creep is one of the more striking challenges facing GIS professionals. There are three ways to approach it: automate, delegate, or hire more. Throwing man-hours at a problem is a solution, but generally not the most cost-effective. As a City, we are moving towards new software that will effectively digitize our records/permits from the point of submission in a SQL database; this will allow us to implement automation to remove the vast majority of maintenance hours for this dataset. The stumbling block here would be the financial cost of these new “city software” packages, along with the knowledge prerequisites in both SQL and Python.
Delegation of duties to other members in your organization, and organizing workflows, can reduce GIS work-hours. While everyone may not be comfortable spinning up ArcDesktop, most office workers can use Microsoft Excel (.xls) just fine; exporting a copy of the dataset as an excel file will allow other members of your organization to update the data. This removes time spent on editing individual fields by replacing that task with an Excel sheet (edited by others); join and then perform a field calculate. The last portion of the workflow is manually attaching documents. Name all scanned documents to include a unique key at some position within the filename (Ex. LocalCoffeeShop_3512.pdf or key6128_LocalTacoShoppe.pdf). With a unique key in place inside the filename, you have the ability to run the geoprocessing tool (using a standard or advanced license) Generate Attachment Match Table. This tool selects a data set, points to a folder on your machine/network, looks for the key field, and generates a table that pairs the files with the match key. Once the Generate Attachment Match Table tool has finished running, you can then run the geoprocessing tool (again, using a standard or advanced license) Add Attachments. This tool will select a data set, a key field, and using the Match Table (previously generated) will attach your documents en masse. Delegation, appropriate workflows, and the right geoprocessing tools, can reduce your maintenance time from a literal working week to the time it takes to run a join, field calculator, and two geoprocessing tools.
As an aside for the unique key: it may seem like a time saver to use the ObjectID or OID; it isn’t. If you ever need to rebuild the layer then your OIDs will all change– –this leaves you with a bunch of filenames that now have incorrect unique keys. The easiest way to create a simple sequential unique key is in Excel. Use the aforementioned Excel export of your dataset, type out a few records in the series, highlight them all, and drag down; Excel has a nice counter function that will auto-fill the numbers in the sequence. Asset management systems like Cartegraph and Cityworks also have unique key requirements, so it may be helpful to future-proof your data that you might be considering exploiting in another software system.
My personal journey was less… …neat. The files were already named without unique keys, the files had identical names (for the same establishment over time) and were only separated by month, and there was a backlog of reports dating back to October 2016. The extra tedious workflow that I followed looked like this: grab copies of all the inspections reports per month-folder, open PDF to view the inspection score, update the field attribute for that establishment, rename the PDF, and attach renamed PDF manually. Lather, rinse, repeat. This was repeated, 1244 times; 30 work hours (I did not average one record a minute). An hour editing session separated by a week or two isn’t that bad, but having a half-year’s worth of those lumped together really puts cumulative inefficiencies into stark perspective.
While my work is by no means one of life or death, the historical realities of the early 20th century that produced our current system of food safety and inspections definitely stemmed from such stakes. Today’s Texans are rightful recipients to the knowledge of what is in our food and in what conditions it is prepared. This web map application allows the citizens of our City and all those that dine within our borders to easily access that information.